The Cockpit is the central dashboard for tracking productivity and code health.
It brings together development metrics, quality indicators, and the impact of Kody’s suggestions, all in one place.
How you can use it:
Start with the overview
Right away, you see a summary of the most important metrics to track your team’s health:
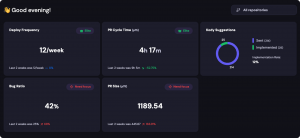
- Deploy Frequency – how many deployments are made per week.
- PR Cycle Time (p75) – the time it takes for a PR to go from opening to merge.
- Bug Ratio – the percentage of PRs that generated bugs.
- PR Size (p75) – the average PR size in lines of code.
- Kody Suggestions – how many suggestions Kody made and how many were implemented.
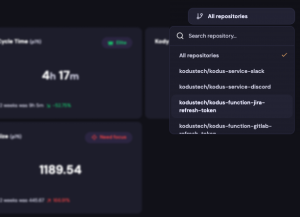
👉 In addition to having an overview, you can filter information by repository to understand the performance of each project individually.
The Cockpit has tabs for Productivity and Code Health.
This is where you find more direct answers to “why” and “where” to make changes.
Productivity Metrics
Productivity metrics show how the delivery flow is performing — from the moment the code starts being written until it reaches production.
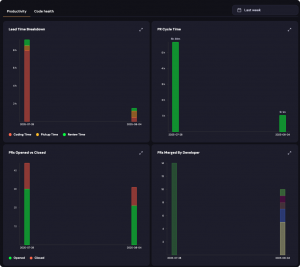
They help answer questions like:
- Are we delivering quickly or getting stuck in long reviews?
- Is the size of PRs helping or getting in the way?
- Is the team maintaining a steady merge pace?
- Is anyone overloaded or under-participating?
Day to day, this serves to:
- Identify bottlenecks before they become a problem.
- Adjust workload and PR distribution.
- Ensure reviews are not blocking delivery.
- See if process changes (for example, breaking down large PRs) are working.
Code Health Metrics
In Cockpit, Code Health shows how many suggestions Kody made for each type of active analysis in your repository (for example, security, performance, maintainability, etc.).
The number is filtered by the selected period, so you can see how the amount of feedback changes over time.
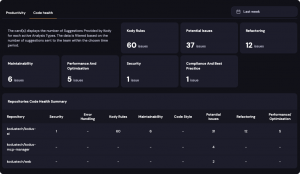
Day to day, this helps to:
- Understand which areas of the code generate the most suggestions (for example, if security consistently has more alerts, it may indicate a point of attention).
- Evaluate if the team is reducing recurring issues — if the volume of suggestions is decreasing, it may be a sign of improvement.
- Identify when new rules or practices increase the number of detected issues (which can be a good thing if they were going unnoticed before).
Team Activity
In Cockpit, the Team Activity section shows how many Pull Requests each developer has opened in a selected period. You can adjust the date range to see delivery pace over time and compare contributions among team members.
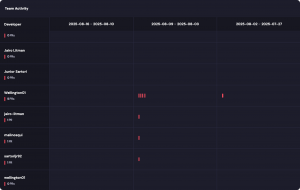
Day to day, this helps to:
- Have a quick view of who is most active in terms of deliveries.
- Identify variations in the number of PRs opened by each person.
- Assess if there is overload or low participation from any member.