Engineering metrics: using data (DORA and others) to improve the team
The conversation around engineering metrics often gets stuck on the wrong things. We end up tracking activities like lines of code or number of commits per week, which say almost nothing about the health of our system or the effectiveness of the team. In practice, these metrics are easy to game and create incentives for the wrong behaviors, like splitting a single logical change into ten tiny commits.
This gets even more complicated with AI-based coding assistants. The 2025 DORA report highlights how AI acts as a problem amplifier. Teams using AI are shipping code faster, but they’re also seeing stability get worse. What happens is that AI makes it easy to generate a lot of code quickly, but if your review processes, testing culture, and deployment pipelines are weak, you’re just pushing broken code to production faster than before.
The core problem is still the same: we need a way to measure the health of the system as a whole, not just the speed of individual developers.
DORA: A framework to understand system health
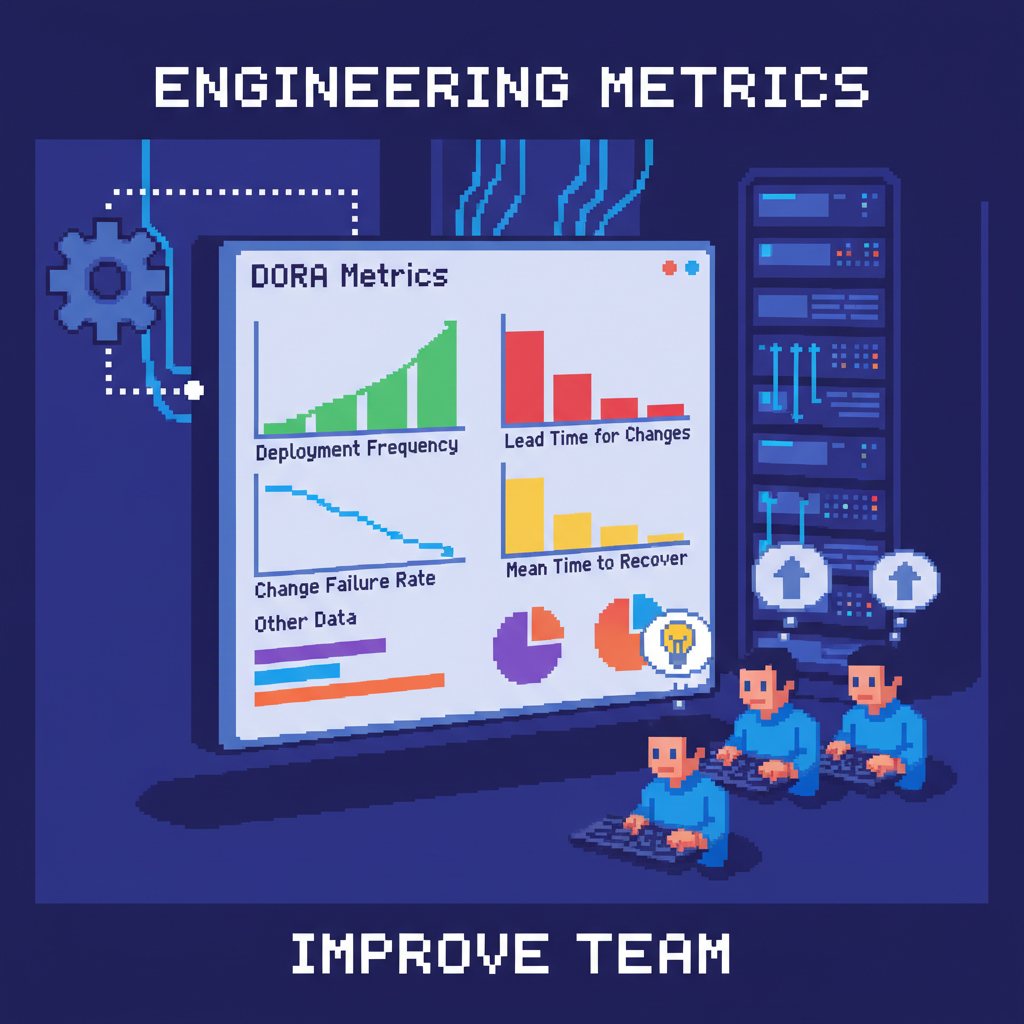
The DORA metrics (Deployment Frequency, Lead Time for Changes, Change Failure Rate, and Mean Time to Recovery) offer a way to do that. They focus on system-level outcomes rather than individual output. Looking at these four metrics together gives you a clearer picture of speed and stability, which often complement each other. Improving one without considering the others usually leads to problems.
Deployment Frequency
This metric measures how often you can successfully deploy to production. A higher frequency generally points to a healthier, more automated CI/CD pipeline and a workflow based on small, manageable changes. When deployment frequency is low, it’s usually a sign of large and risky batches, manual deployment steps, or fear of breaking things. For a tech lead, tracking this can help justify investments in better CI or more robust testing.
Lead Time for Changes
This is the time it takes for a commit to reach production. It’s one of the most useful diagnostic metrics for a team. A long lead time can point to several different issues: PRs that are too large, a slow code review process, flaky tests in the CI pipeline, or manual QA gates. By breaking lead time into stages (time to first review, time in review, time to merge, time to deploy), you can pinpoint exactly where work is getting stuck. If PRs sit idle for days waiting for review, that’s a team process conversation, not an individual developer speed issue.
Change Failure Rate
This metric tracks how often a production deployment causes a failure, such as an outage or a rollback. It’s a direct measure of quality and stability. A high failure rate suggests that your testing and review processes aren’t catching issues before they reach users. This often correlates with large batches, since bigger changes are harder to understand and test thoroughly.
Mean Time to Recovery (MTTR)
When a failure happens, how long does it take to restore service? That’s MTTR. A low MTTR is a sign of a resilient system and a solid incident response process. It shows that you can detect problems quickly, diagnose them effectively, and roll back or fix issues without causing new ones.
AI and engineering metrics
AI tools for code don’t change the basic principles of how software is delivered. What they do is amplify what’s already there. AI works as a multiplier of the systems and practices a team already has. If you have strong technical fundamentals, a habit of working in small batches, and a healthy review process, AI tends to accelerate all of that and reduce friction.
The real risk shows up when those practices don’t exist. If your team already tends to create huge pull requests, AI will help generate even bigger PRs, just faster. If there’s already a lot of technical debt, AI-generated code without context can easily make it worse.
That’s why good practices become even more important with AI, especially working in small batches, which becomes even more critical. A small, well-understood change is always safer to ship to production, whether it’s written by a person or with the help of AI.
What needs to be in place before using AI, according to DORA
To get value from AI without amplifying existing problems, teams need a solid foundation. DORA’s research summarizes this into seven essential capabilities for adopting AI the right way:
1. Clear guidance on AI usage
Everyone on the team needs to know the rules of the game: which tools can be used, what kind of data can be shared, and how to handle AI-generated code in day-to-day work.
2. Healthy data ecosystems
The quality of the help AI provides depends directly on the quality of the data behind it. Garbage in, garbage out.
3. Internal data accessible to AI
To be truly useful, AI needs context. That includes internal libraries, APIs, company standards, and relevant documentation.
4. Working in small batches
Working with small changes reduces risk and keeps the feedback loop short. This becomes even more important when code can be generated very quickly.
5. Focus on the end user
AI is a means, not an end. It should help solve real user problems, not just increase the amount of code produced.
6. Well-maintained internal platforms
A good internal platform removes repetitive work and provides clear paths to test and deploy. That makes it much safer to integrate AI-generated code.
7. Strong technical fundamentals
Loosely coupled architecture, comprehensive test automation, and solid engineering standards are not optional.
Other metrics that can help
DORA metrics go a long way toward understanding the health of the delivery pipeline, but on their own they don’t explain everything. Other frameworks complement this view by connecting delivery performance to developer experience and overall value flow.
SPACE
The SPACE framework broadens the view of what actually makes developers productive and satisfied. It argues that you can’t measure output alone. To understand real productivity, you need to look at multiple signals at the same time:
- Satisfaction and well-being: How fulfilled and healthy are your engineers? Burnout is a major productivity killer.
- Performance: How do individuals and teams perceive their own performance?
- Activity: Output metrics like commits or PRs. They’re useful, but dangerous when analyzed in isolation.
- Communication and collaboration: How well do people and teams work together? Think about how easy it is to find information and the quality of reviews.
- Efficiency and flow: How effectively can developers work without interruptions or friction? This ties directly to DORA’s Lead Time for Changes.
The goal of SPACE is to create a balanced set of metrics so you don’t accidentally optimize one area at the expense of another, like increasing activity at the cost of burnout.
Value Stream Management (VSM)
Value Stream Management is a way to visualize, measure, and improve the entire process, from idea conception to customer delivery.
While DORA gives you key outcomes (like lead time), VSM helps map all the intermediate steps to understand why your lead time is what it is. It focuses on flow metrics such as:
- Flow Velocity: How many work items are completed per unit of time?
- Flow Time: How long does an item take from start to finish? (Similar to Lead Time)
- Flow Load: How many items are currently in progress? (A proxy for WIP)
- Flow Efficiency: What percentage of the total flow time is spent on active work versus waiting? This is often the most revealing metric. It’s common to discover that a ticket spends 90% of its time just waiting for a review, a build, or a handoff.
VSM adds context to DORA metrics. Your Change Failure Rate might be high, and a value stream map might show that this happens because there’s no dedicated time for QA, forcing developers to rush tests at the last minute.
Using metrics to improve the team
Collecting metrics doesn’t help much if you don’t act on them. The idea is to use the data to spark good conversations and improve the team, not to create yet another dashboard that no one opens. The DORA improvement loop helps close that gap.
The DORA improvement loop
Establish a baseline: First, simply measure your four core metrics to understand where you are today. You can’t improve what you don’t measure.
Have a conversation: Metrics tell you what is happening, but not why. The next step is to talk with the team. A value stream mapping exercise can be extremely useful to visualize the entire process, from idea to production, and identify where the real friction is.
Commit to improving the biggest constraint: Don’t try to fix everything at once. Identify the biggest bottleneck slowing the team down or causing failures and focus on that.
Turn the commitment into a plan: Create a concrete plan with leading indicators. For example, if the bottleneck is code review time, an indicator might be “average PR size” or “time from PR open to first comment.”
Do the work: This involves systemic changes, not quick fixes. It might mean investing in better tools, changing a team process, or paying down a specific chunk of technical debt.
Check progress and iterate: After a few weeks or a sprint, review your DORA metrics and indicators to see if the changes had the expected effect. Then choose the next biggest constraint and repeat the cycle.
It’s also useful to remember that DORA isn’t the only framework. The SPACE framework is a great complement, as it brings in developer satisfaction, well-being, and collaboration.
The most common mistakes when using engineering metrics
When you start using these metrics, it’s easy to fall into a few common traps.
Using metrics to evaluate individual performance: This is the fastest way to destroy trust and encourage metric gaming. DORA metrics measure team and system performance, period. They should never be used in individual performance reviews.
The “gaming” metrics trap: If you incentivize a specific metric, people will find a way to optimize it, often at the expense of what actually matters. For example, focusing only on Deployment Frequency can lead a team to ship tiny, meaningless changes just to inflate the number.
Metrics overload: Don’t try to measure everything. Start with the four core DORA metrics. Once you have a handle on them, you can add others, but keep the focus on a small set of indicators directly tied to your improvement goals.
Not acting on the data: The worst outcome is spending time and effort collecting data and then doing nothing with it. Metrics should always be a catalyst for conversation and action. If they aren’t, it’s worth asking why you’re collecting them in the first place.
Some recommendations
If the goal is to use data more deliberately to improve the team, here’s a path you can follow:
– Establish baseline DORA metrics: Use a tool or script to get an initial reading of the four core metrics. This gives you a starting point.
– Focus improvement efforts on the team’s biggest constraint: Work with the team to identify the most painful bottleneck right now and make a clear agreement to focus on improving that first.
– Treat AI adoption as a systemic change: It’s not just about handing out Copilot licenses and hoping for the best. Set clear guidelines and reinforce good habits so AI doesn’t simply accelerate existing problems.
– Complement DORA with other frameworks: Consider using elements of SPACE to get a more complete view that includes developer experience.
– Embrace continuous improvement as a cultural practice: The goal isn’t to achieve a “perfect” score on metrics. It’s to build a culture where the team is constantly working to improve its workflow and the health of its systems.